Get My Full Trading System Added to Your Charts Automatically
Get full access to all of Jerry Romine’s TradingView Indicators. You can cancel anytime through your PayPal account. After checkout, complete the quick form and we’ll add your indicators to TradingView within 1 business day. No contracts. Cancel anytime.

1. Jerry’s Buy Sell Indicator
The Buy Sell Indicator: View On TradingView
Provides short term trend information, early buy signals for high conviction stocks, standard buy signals, and sell signals. 14 user controlled inputs allow the user to customize the settings.
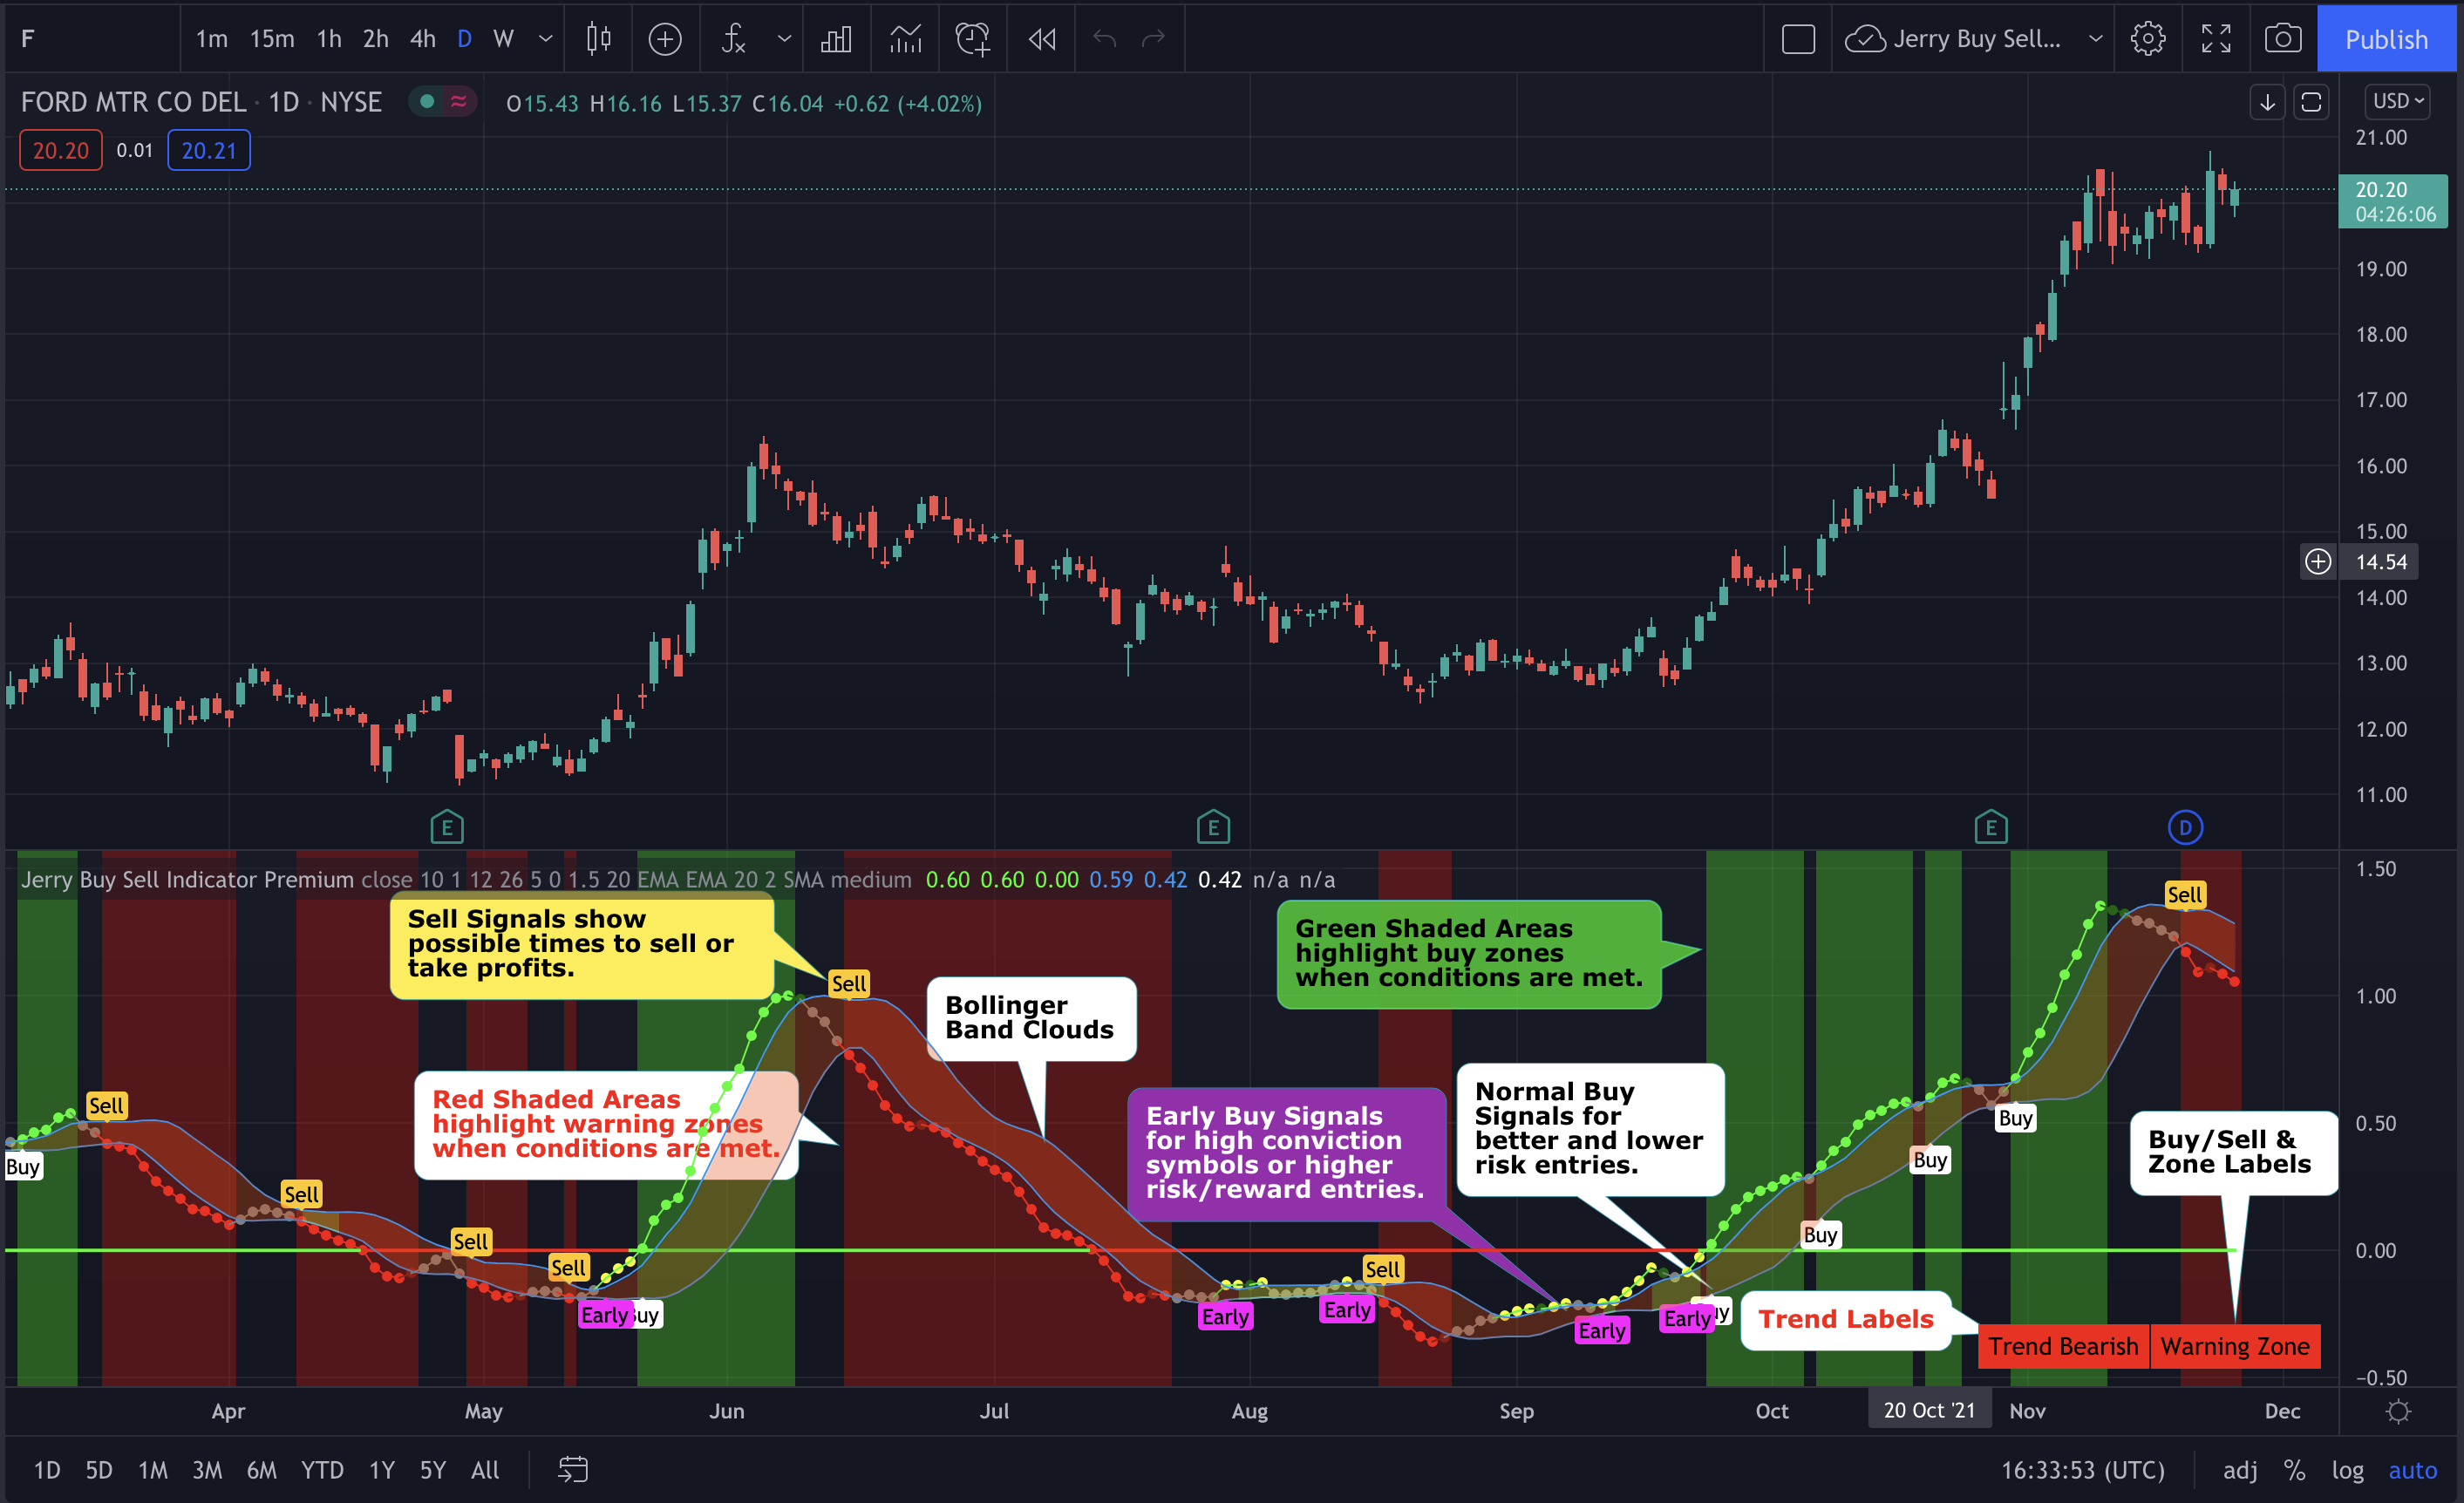
This indicator has unique conditions in the script that create the following:
1. Buy and Sell zones
2. Early Buy, Buy and Sell signals that are determined by conditions including relative position to the zero line.
3. Defines 6 different short term trends
4. Trend Labels to show the current short term trend.
5. Buy, Sell, Buy Zone & Warning Zone Labels
6. 14 user controlled inputs allow the user to customize the settings.
7. Unique functionality that allows you to create trade alerts based on conditions being met with criteria scans built into the indicator.
# 7 is very cool and a powerful unique feature of our indicator. For example you can easily create a TRADE ALERT for a symbol based on a Buy Signal being met in any time frame. This is possible because we have built into the script the ability to select multiple conditions including BUY ALERT, EARLY BUY ALERT AND SELL ALERT. You can also use the alerts to scan your stocks individually for buy zones and warning zones (green shading and red shading) or for crossing above or below the clouds. TradingView alerts can notify you via pop-up, email, sound notification, email to SMS & sound notifications.
BUY SELL INDICATOR FEATURES
—– TRENDS
Red Dots (Red Cloud) = Warning zone. Generally do not buy or consider selling.
Dark Red Dots = Warning BUT Improving. Things are getting better.
Grey Dots = Neutral. No clear short term trend.
Yellow Dots = Early. Great for high conviction stocks but early for the main buy signal.
Dark Green Dots = In the buy zone but losing strength.
Green Dots (Green Cloud) = Trend is bullish & stock is in the buy zone.
Trend Line = Shows the prevailing direction of price and if the momentum is beamish, bullish or neutral.
—– BUY & SELL SIGNALS
Early Buy Bubble= The first day the Early Buy signal is triggered. Early Buy Signals occur below the zero line and are higher risk/reward. This is a unique feature of this indicator.
Buy Bubble = Indicator Buy Signal Triggered. Buy Signals occur above the zero line.
Sell Bubble = Indicator Sell Signal Triggered.
—– WAYS TO USE THE INDICATOR
1. Buy/Sell during with the main buy and sell Alerts in the Buy (green shaded) and Warning (red shaded) zones.
2. In The Red You’re Dead. Most buy signals happen outside of the red warning zone. There are exceptions like reversals and momentum squeezes.
3. Buy Sell Indicator can be used by itself or with other indicators (Momentum Dream works well)
4. Use Red and Green Clouds/Shading to assist with position direction. In the buy zone look to go long. In the red zone generally do not add to your position or consider selling.
5. Use Red Clouds to tighten stops or close positions.
6. Customize the indicators to vary the results by selecting Wilders, SMA, EMA, WMA, and HullMA moving averages.
7. The early buy signal/bubble appears on the chart the first day the early buy signal is triggered and can be used for entry into high conviction stocks or if you want to take a higher risk/reward trade.
8. The standard buy signal is shown when conditions have been met to indicate a better buy entry point with less risk.
2. Jerry’s Momentum Dream Indicator With Risk Management
The Momentum Dream Indicator with Risk Management are really two powerful indicators combined in one.
The Momentum Dream Indicator is a volatility and momentum indicator that measures the relationship between the Bollinger Bands and Keltner Channels to help identify consolidations and signal potential breakouts.
MOMENTUM DREAM INDICATOR: View On TradingView
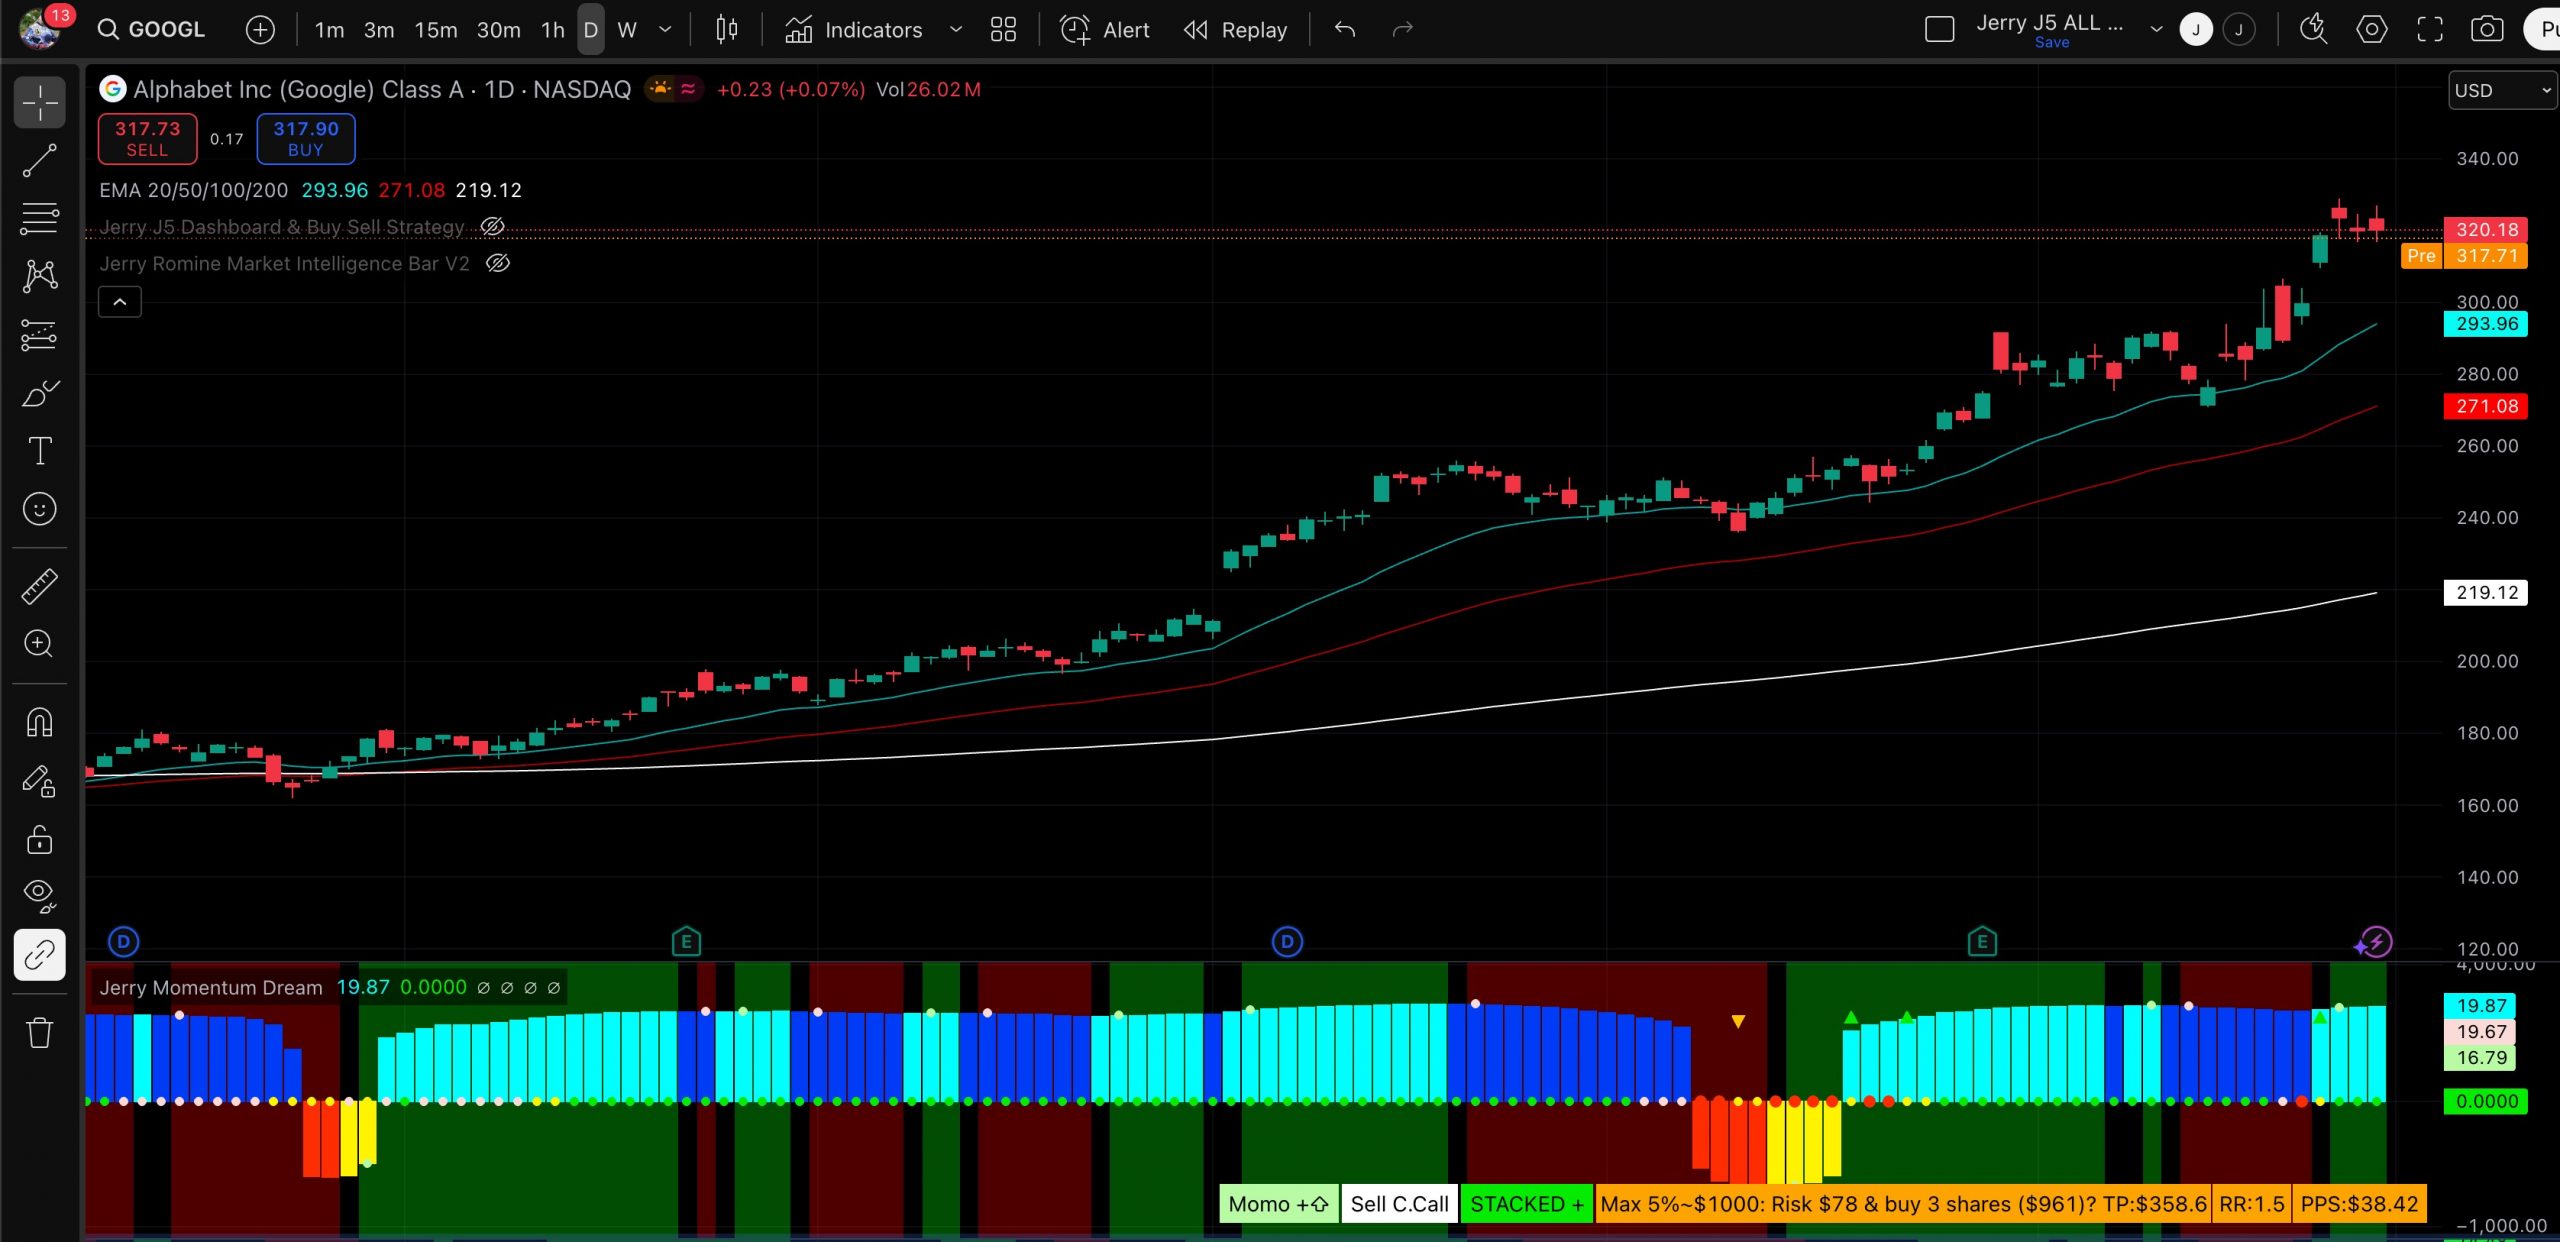
SQUEEZE LINE COLOR DEFINITIONS:
Dark Red = Extra Squeeze (In & Out)
Red = Original Squeeze (In & Out)
Pink = Pre-Squeeze (In)
Yellow = Pre-Squeeze (Out)
Green = Bollinger Bands are officially outside of Keltner Channels
SIGNALS AND ZONES:
Green Arrow = Post Squeeze Buy Triggered = GREEN ⇧ shows squeeze out on upward momentum (often a good time to buy)
Orange Arrow = Post Squeeze Sell Alert = ORANGE ⇩ shows squeeze out on downward momentum (often a good time to sell or NOT buy)
Green Dot on Chart – Day one of the buy zone
Green Shading – Buy Zone
Pink Dot on Chart – Day one of warning zone
Red Shading – Warning zone. Often a good time not to buy or to consider selling.
LABELS (Color Indicates Direction):
Momo Up / Down = Current momentum direction.
Squeeze = Squeeze is on and squeeze line dots are red.
Dots = number of day or bars the squeeze has been in red(on)
Squeeze Fired = Green or Orange arrow shows squeeze fired direction.
Staked = Fibonacci 8, 21, 34, 55, 89 EMA are stacked up or down
MOMENTUM DREAM STRATEGY
There are multiple ways the Momentum Dream Indicator can be used.
1. Buy/Sell during the squeeze (generally lower volatility and lower option premiums)
2. Buy/Sell when the squeeze fires to catch the breakout (volume/volatility often increase)
3. Use Buy/Sell Zones with other signals for entering positions
4. Use Momentum to assist with position direction
5. Use fading momentum to tighten stops or close positions.
RISK MANAGEMENT INDICATOR
Risk management is a vital part of investing and this indicator provides 2 recommended position sizes. One based on the classic 1-2% risk rule where you never risk more than X% of your account. A second based on position size not exceeding X% of your account.
All of the match is done for you providing you a risk management and trading plan based on your customizable criteria.
RISK MANAGEMENT COMPONENTS:
Account Size = An amount you specify for the calculations
Max % Per Trade = The max % value of a stock you would own in your portfolio. Example 10%
Percent Rule = The maximum amount of your account you will risk on trade when considering your trail stop. Example 1 or 2 %.
ATR Multiple = Value used to compute your trail stop. Typically 2-3
Trail Stop = The recommended trail stop based on the stocks volatility (ATR)
Risk Reward Ratio = Recommended 1.5 – 2. Used to create profit target.
Target Price = Automatically calculated based on your settings (above)
Profit Per Share = Your per share profit goals.
The Risk Management Indicator does all of the hard math and provides you with a realistic trading plan, position size, and trail stop based on your customizable criteria. If you’ve ever wondered how much of a stock to buy, when to sell and when to take profits this indicator is for you!
3. Jerry’s TradingView Bar – View On TradingView
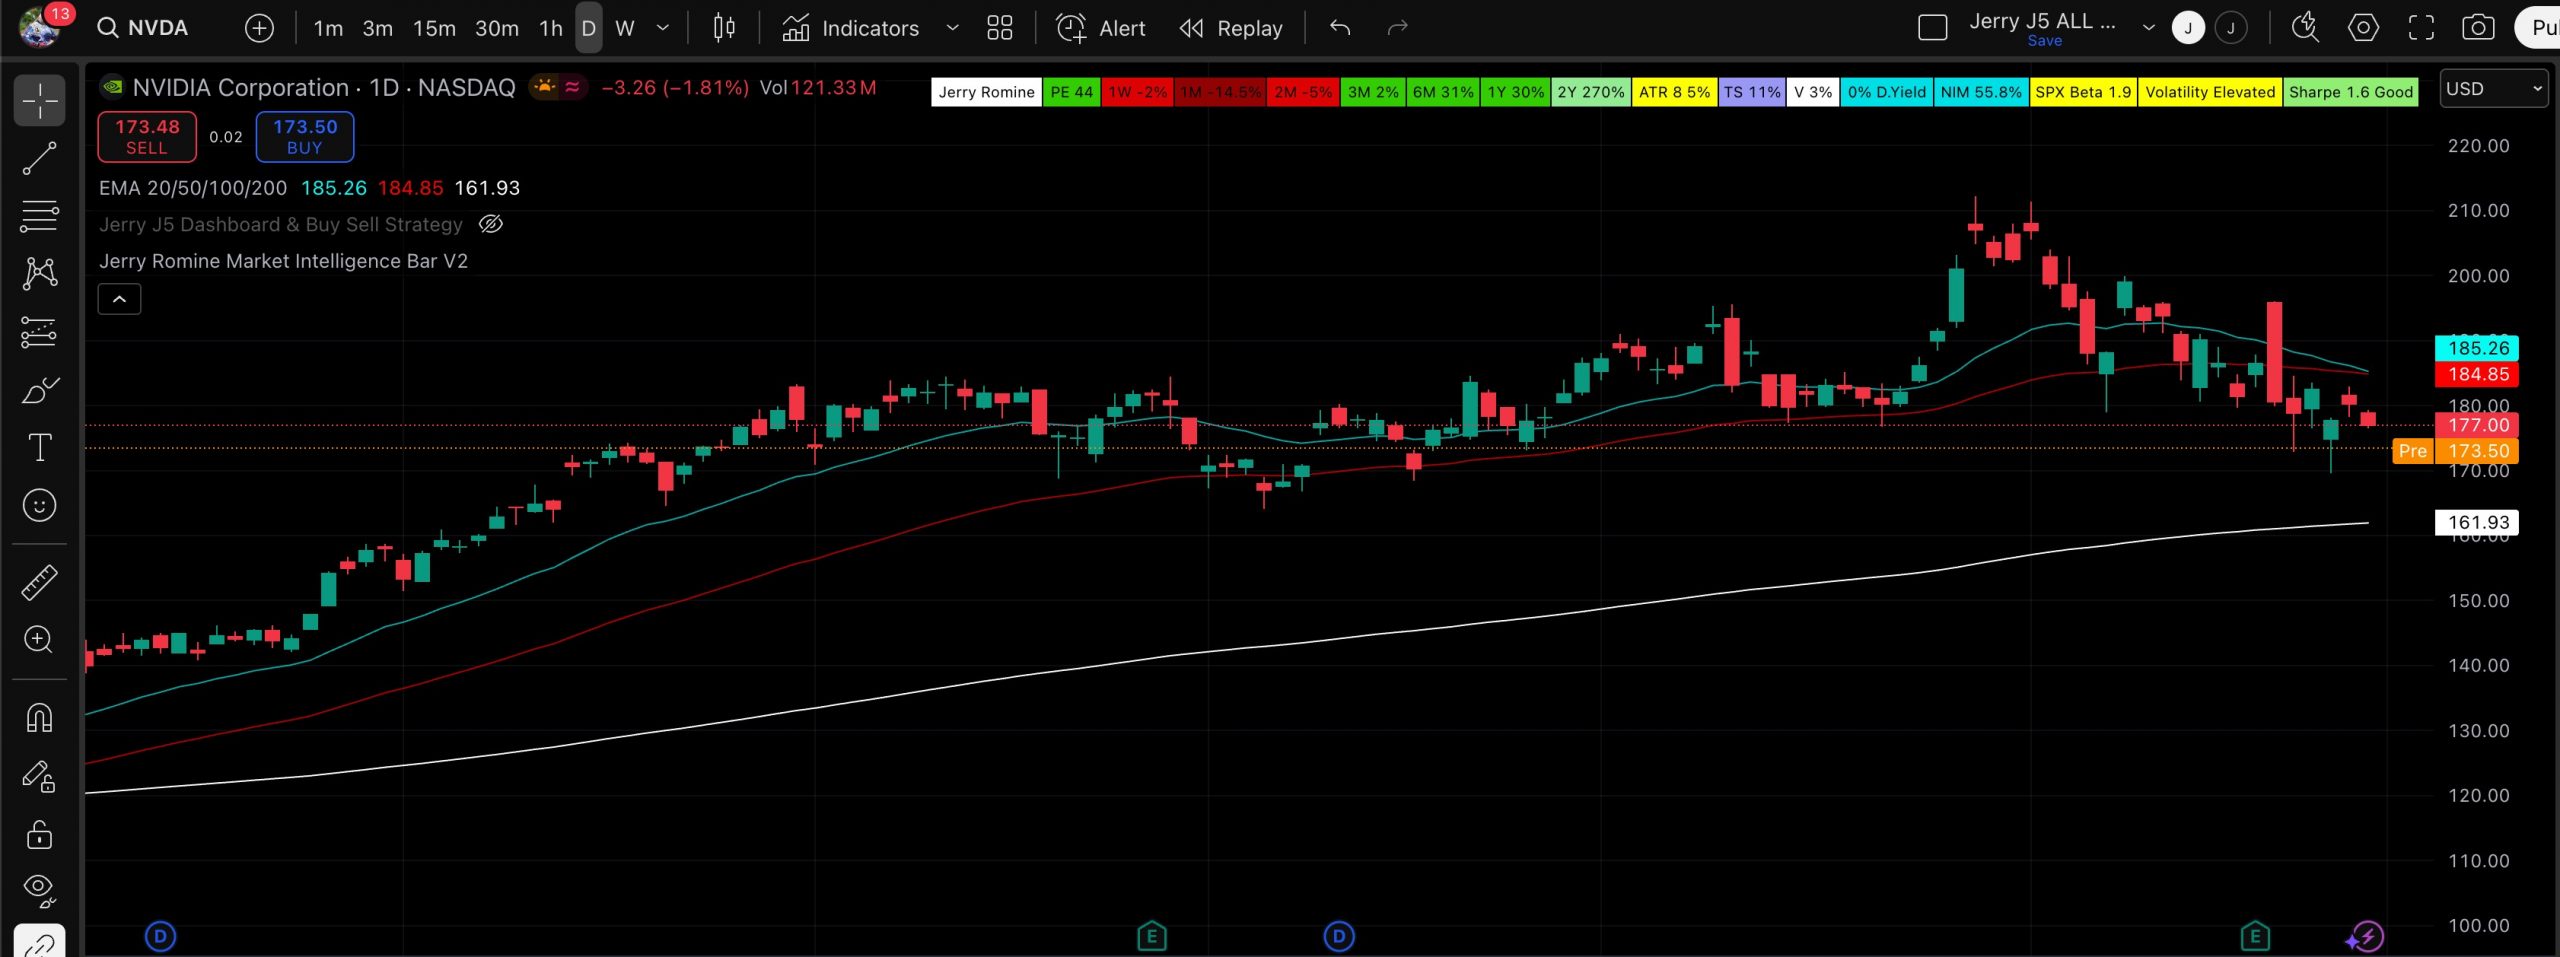
Jerry’s TradingView Bar gives you a quick read of the stock, index, or cryptocurrency at a glance. The indicator components are:
- Price to Earnings Ratio
- Price Performance over various time frames
- ATR (volatility indictor)
- Recommended Trail Stop (Can edit based on ATR)
- Volume Percent
- Net Income Margin
- Beta Indicator/Label
- Volatility Label
- Sharpe Ratio (This is POWER)
4. Jerry J5 Dashboard & Buy Sell Strategy Indicator – View On TradingView
The strategy allows you to select from multiple moving averages and uses the concave function and the price being above or below a user defined EMA to provide buy and sell signals. You can select long trades, short trades, or both.
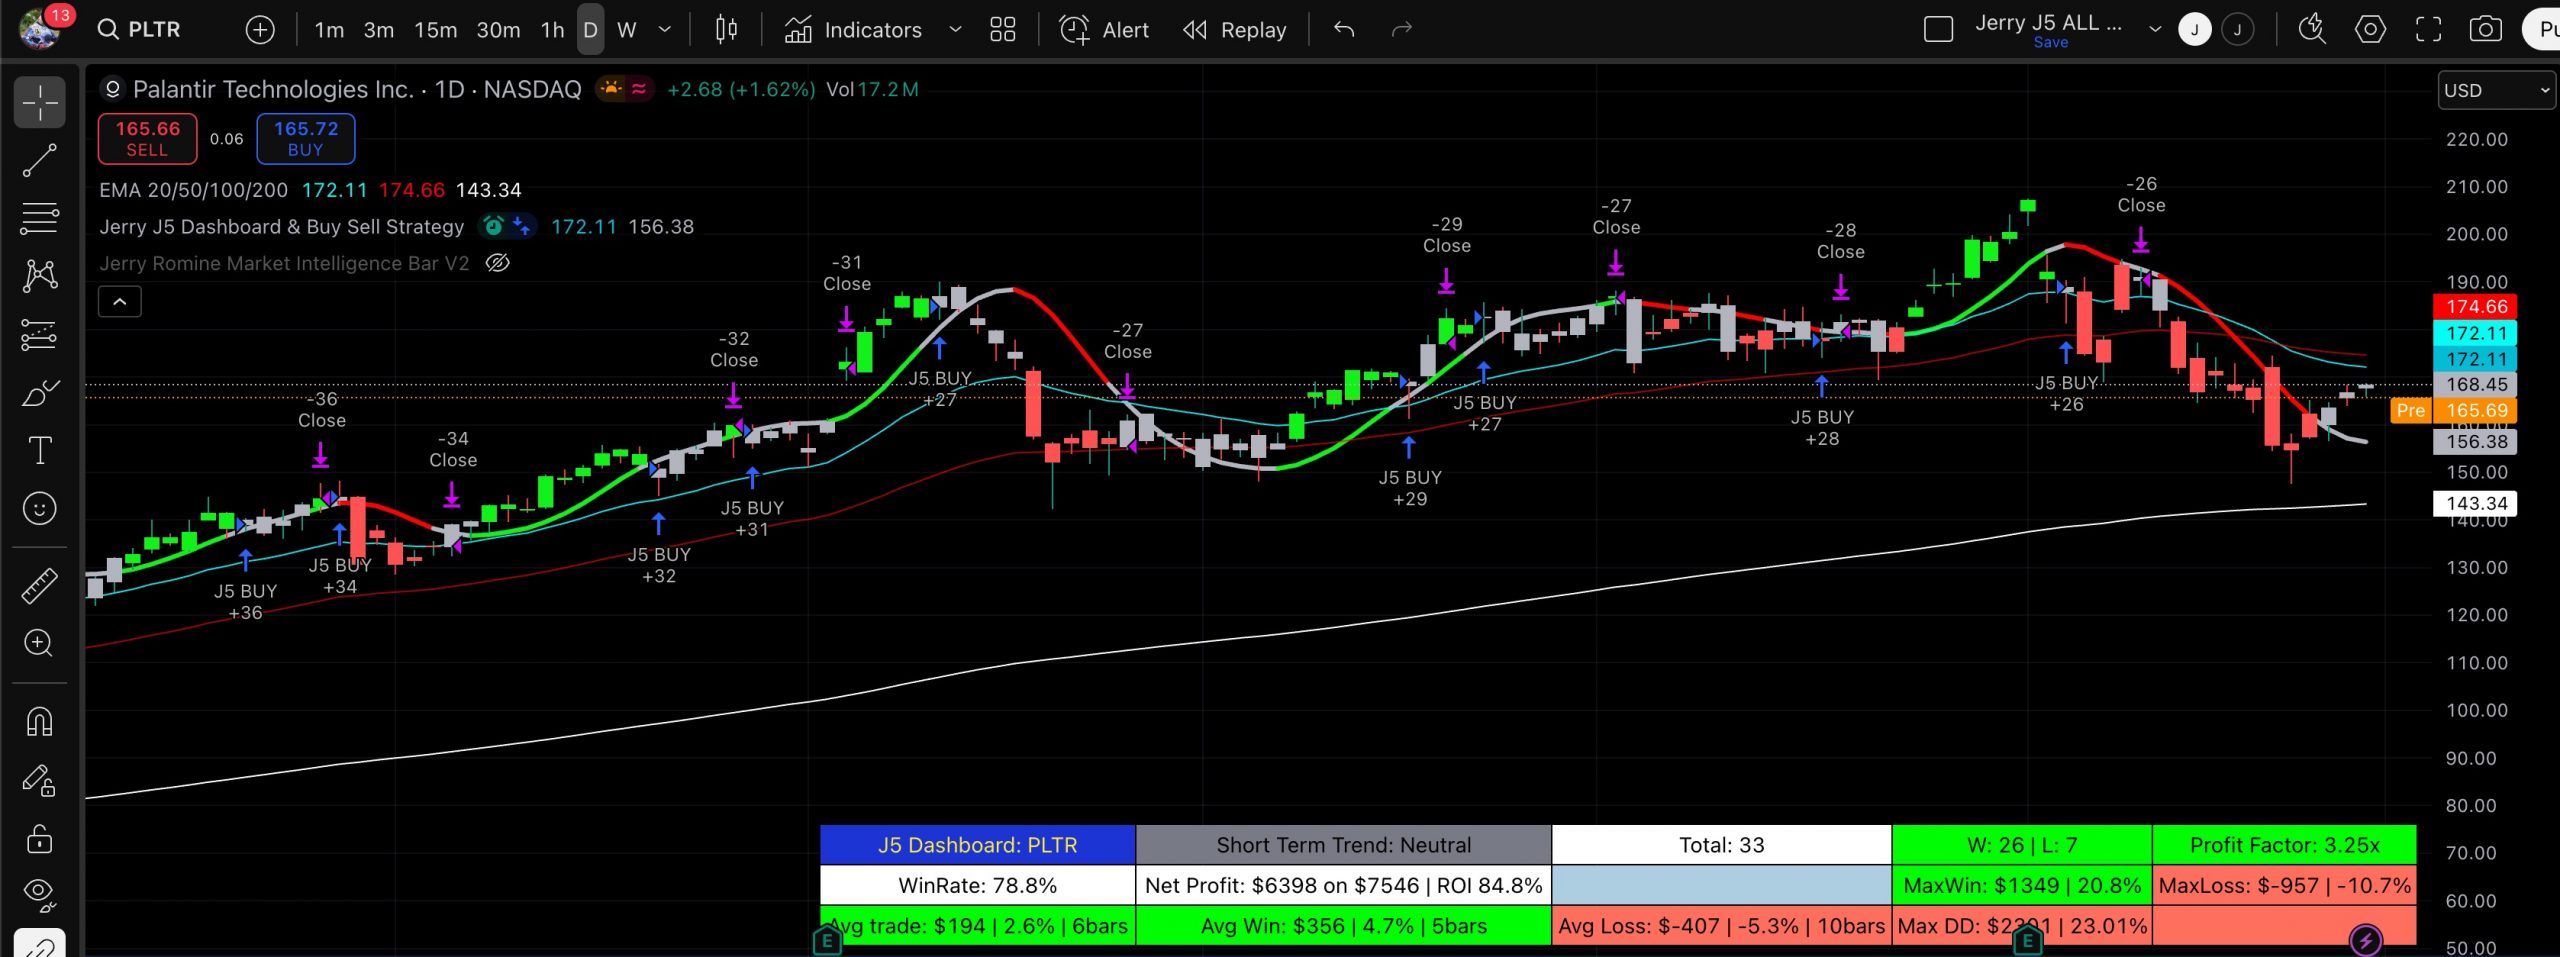
For the dashboard you are able to set the target profit factor, win rate, net profit target ROI , winning trade target ROI , Strategy Start Date, and the Buy and Hold Start Date. The inputs are used to color dashboard labels making it easier to identify winning and losing trades based on your criteria.
SUBSCRIPTION INFORMATION
- All 4 Indicators are only $30.00 a month (total) . Subscribe with PayPal & cancel anytime.
- After subscribing we will authorize your TradingView access within 1 business if you provided the correct TradingView Username.
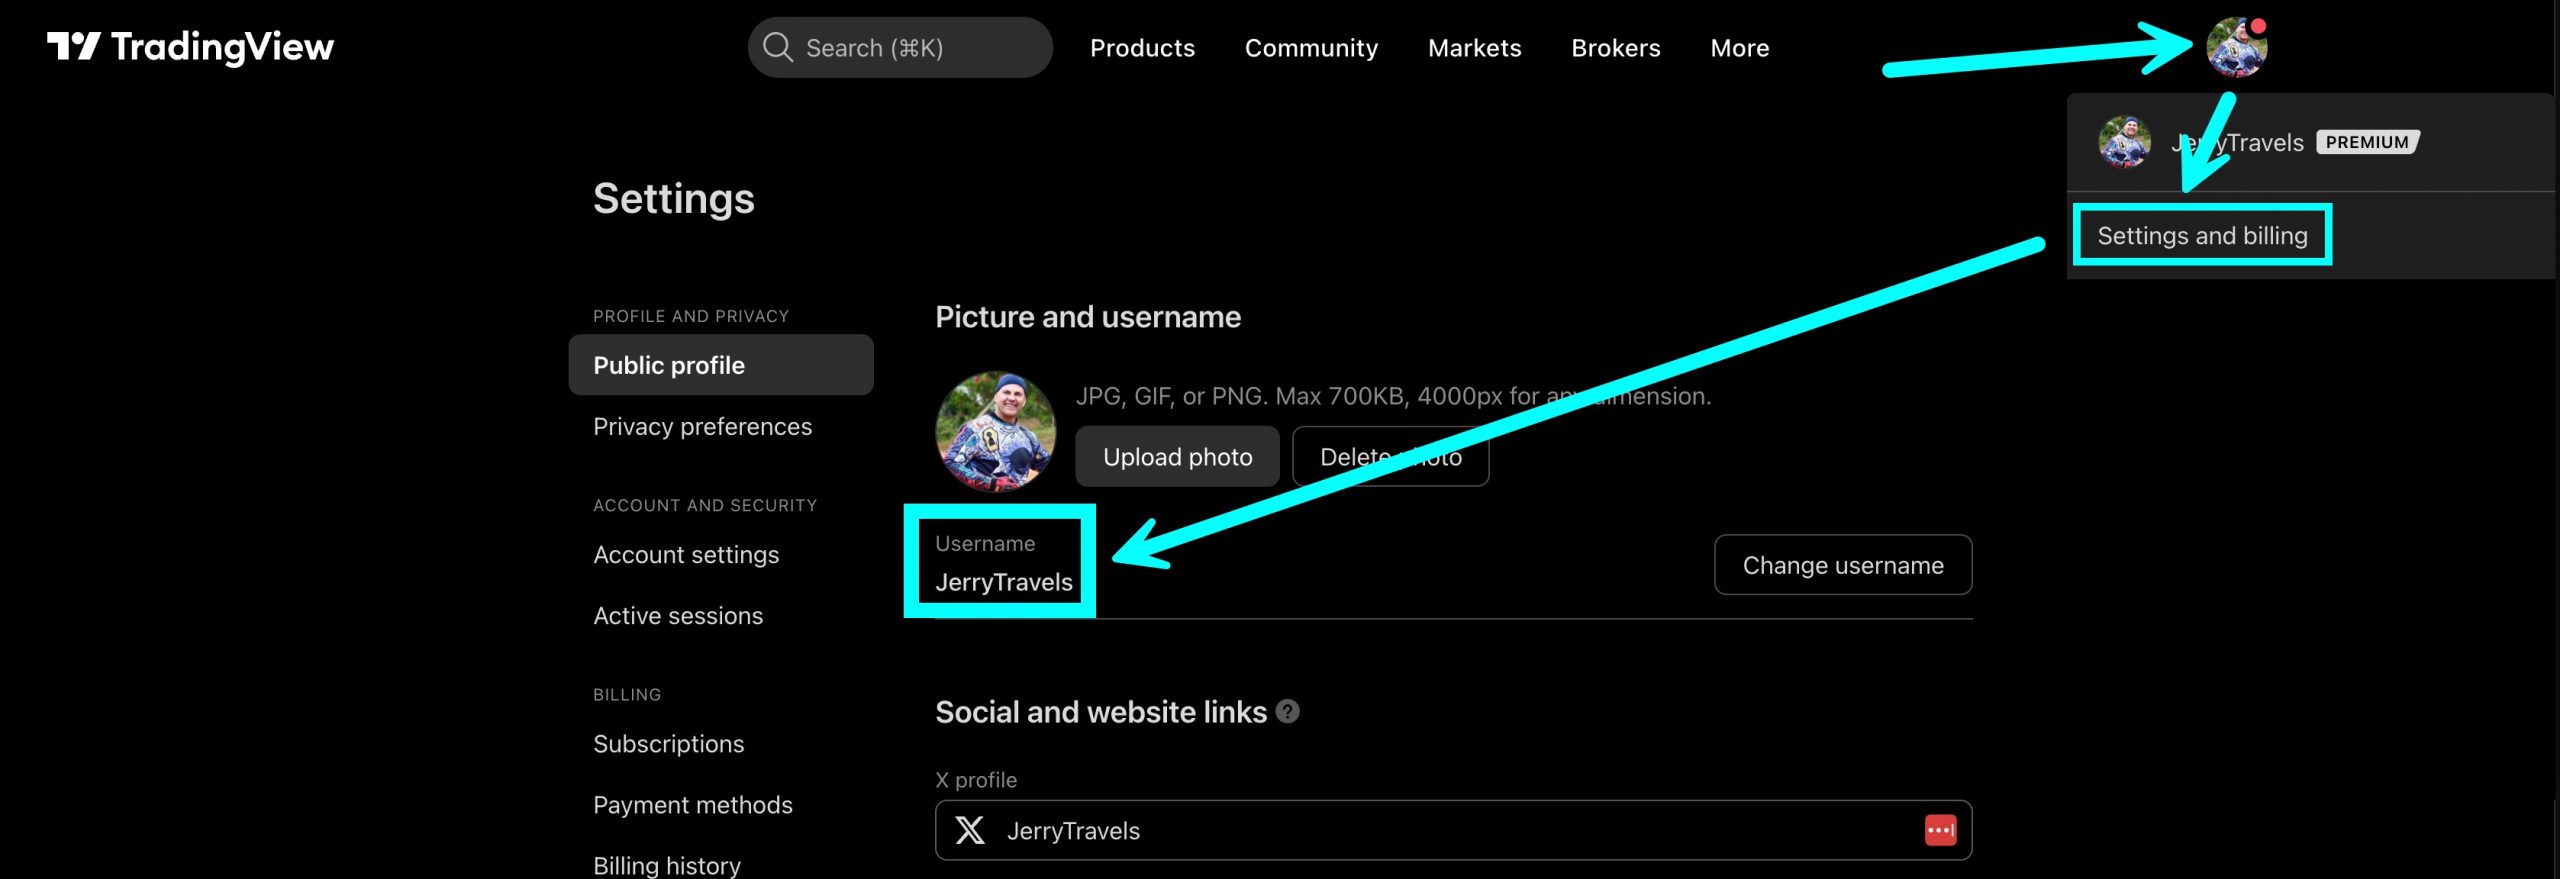
- If you did not receive the authorization within 1 business days send a private message to JerryTravels on TradingView and include your PayPal email address(to confirm subscription).
HOW TO FIND YOUR INDICATORS AFTER SUBSCRIBING
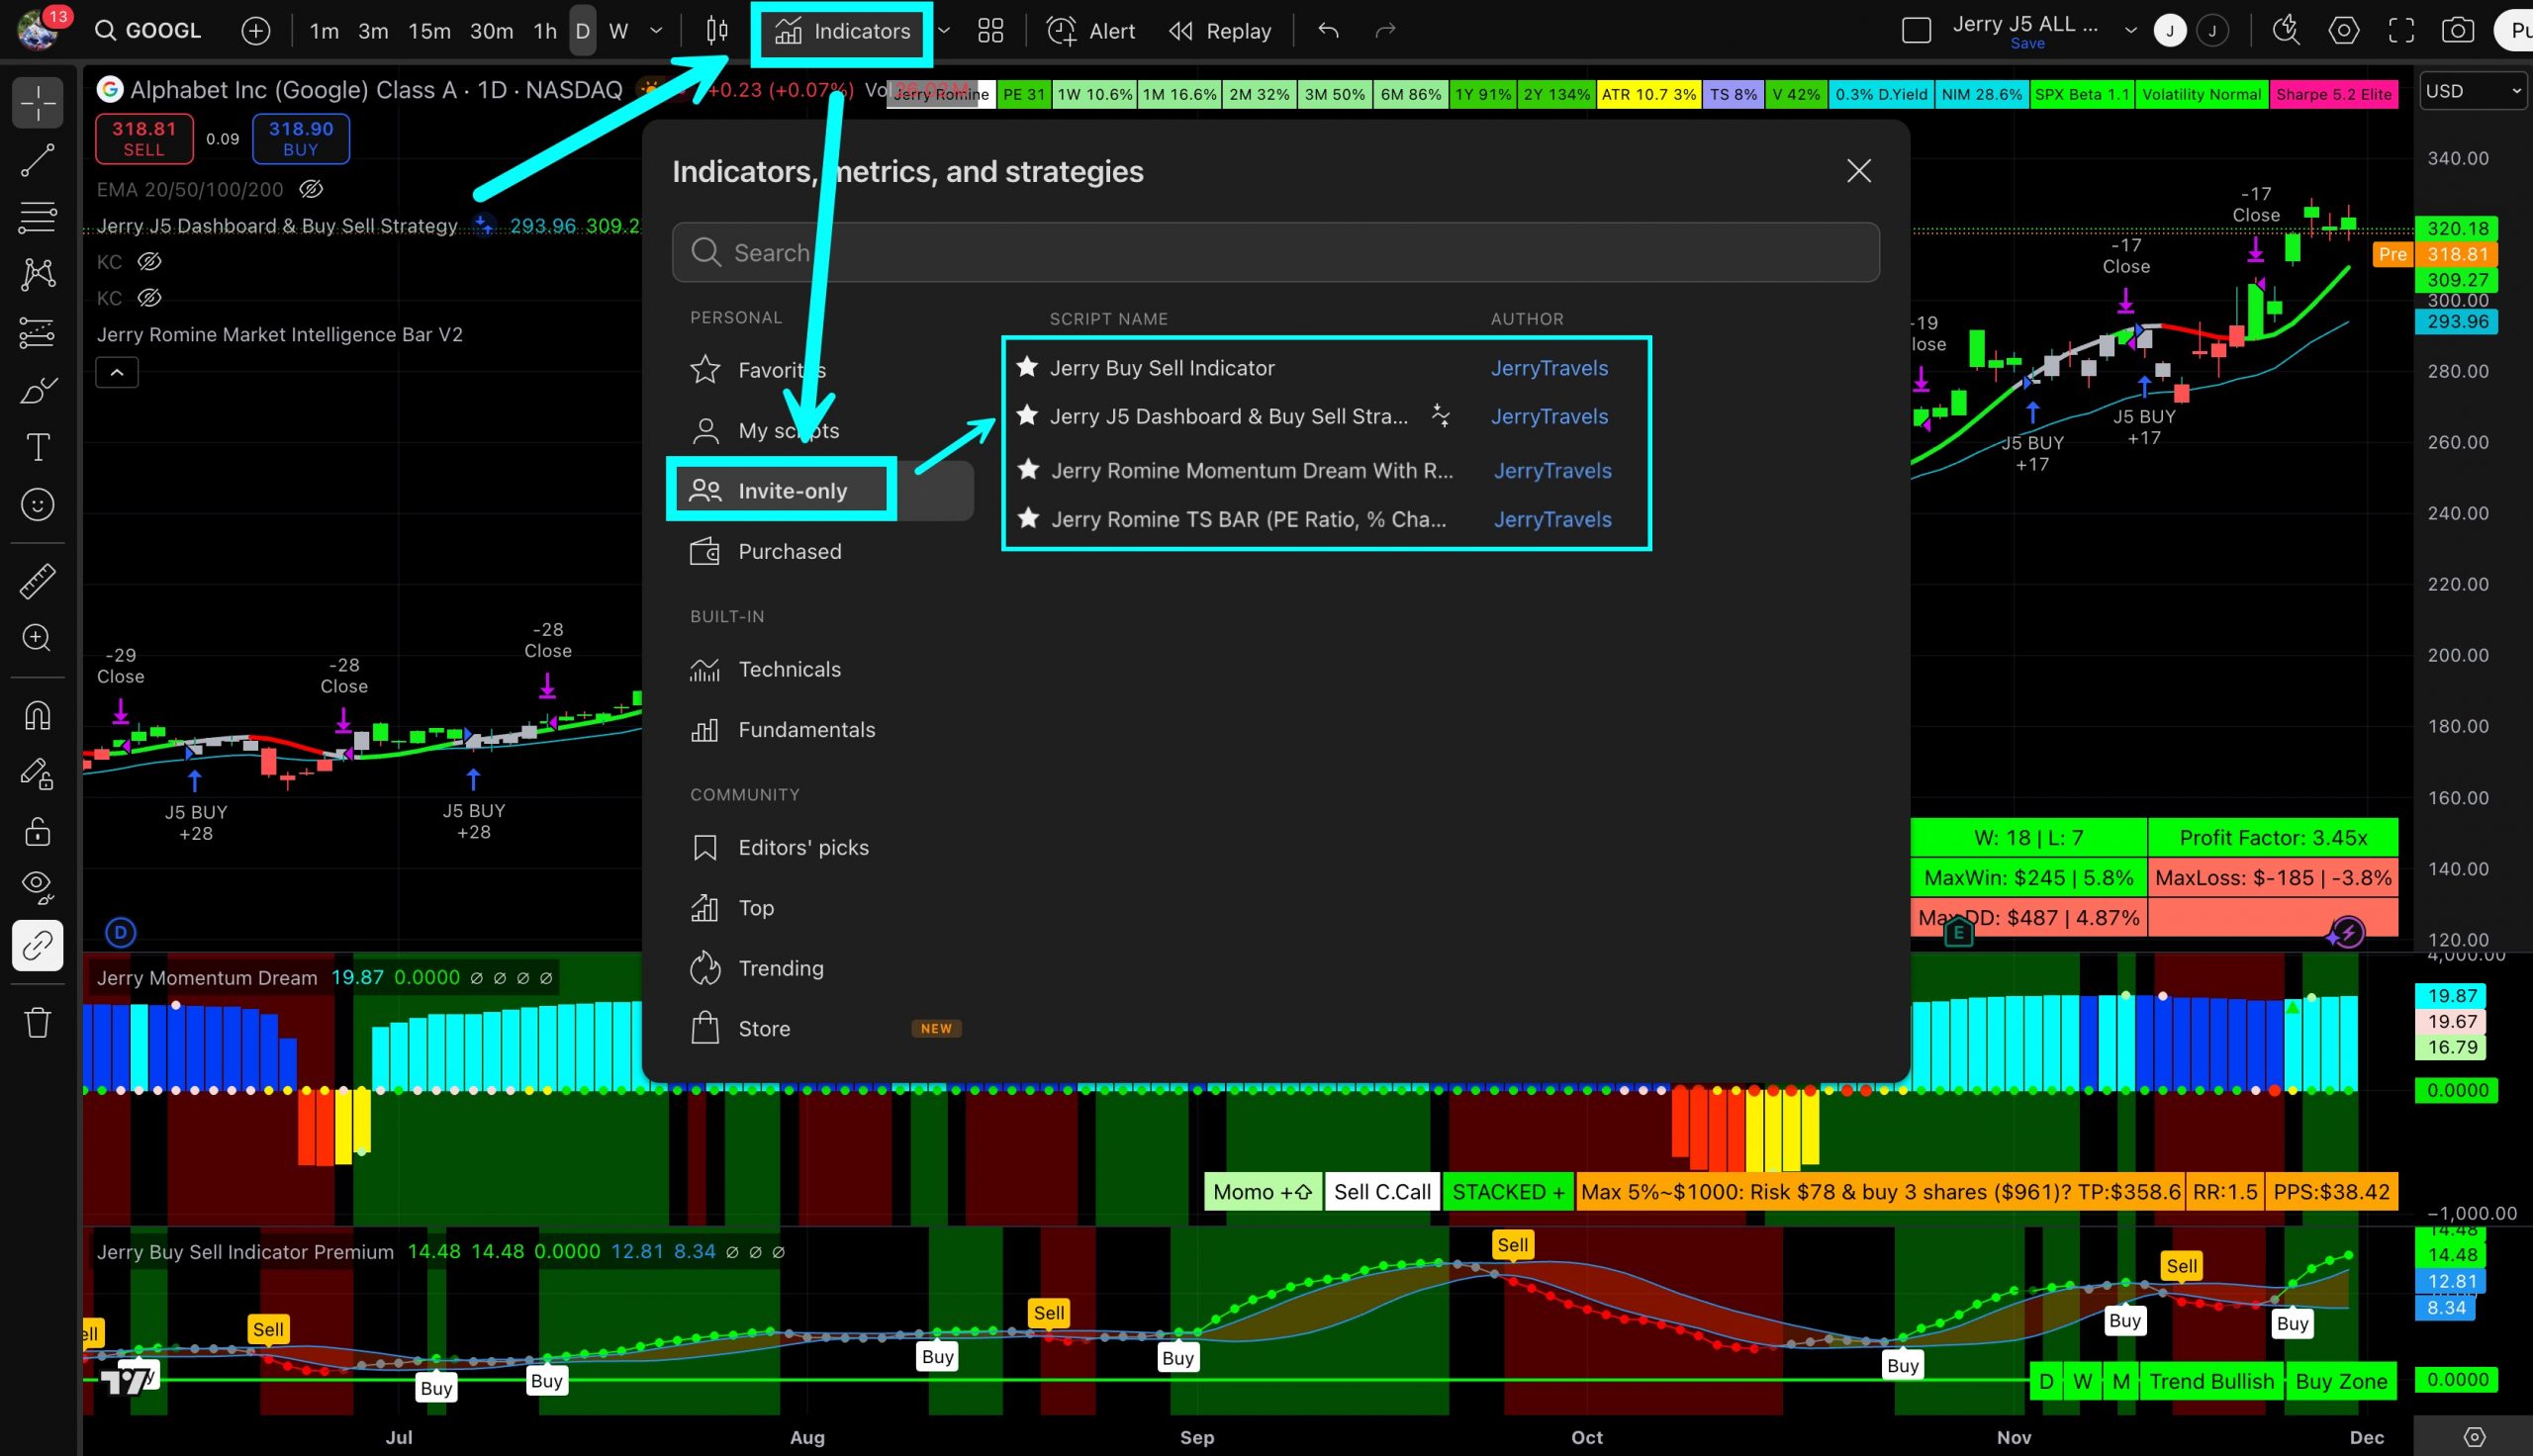
After subscribing and submitting your Authorization Form allow 1 business day for your indicators to be authorized and ready.
To find your new indicators click on INDICATORS then Invite-only. If the locks are red refresh or reload TradingView. If your scripts have been authorized the locks will be green. Click on the star to favorite the indicator and then double click to install.
HOW TO FIND YOUR TradingView USERNAME
Click on your PROFILE PICTURE, then SETTINGS and BILLING. Copy and Paste your username to ensure accuracy.